Every channel swears the conversion is theirs. The model shows who actually drives sales.
Marketing mix modeling on Google Meridian or Meta Robyn, delivered as an on-demand project: real per-channel incrementality, budget reallocation scenarios and quarterly recalibration. AI agents do the heavy lifting, with QA on every run; a senior media strategist signs off on the read.
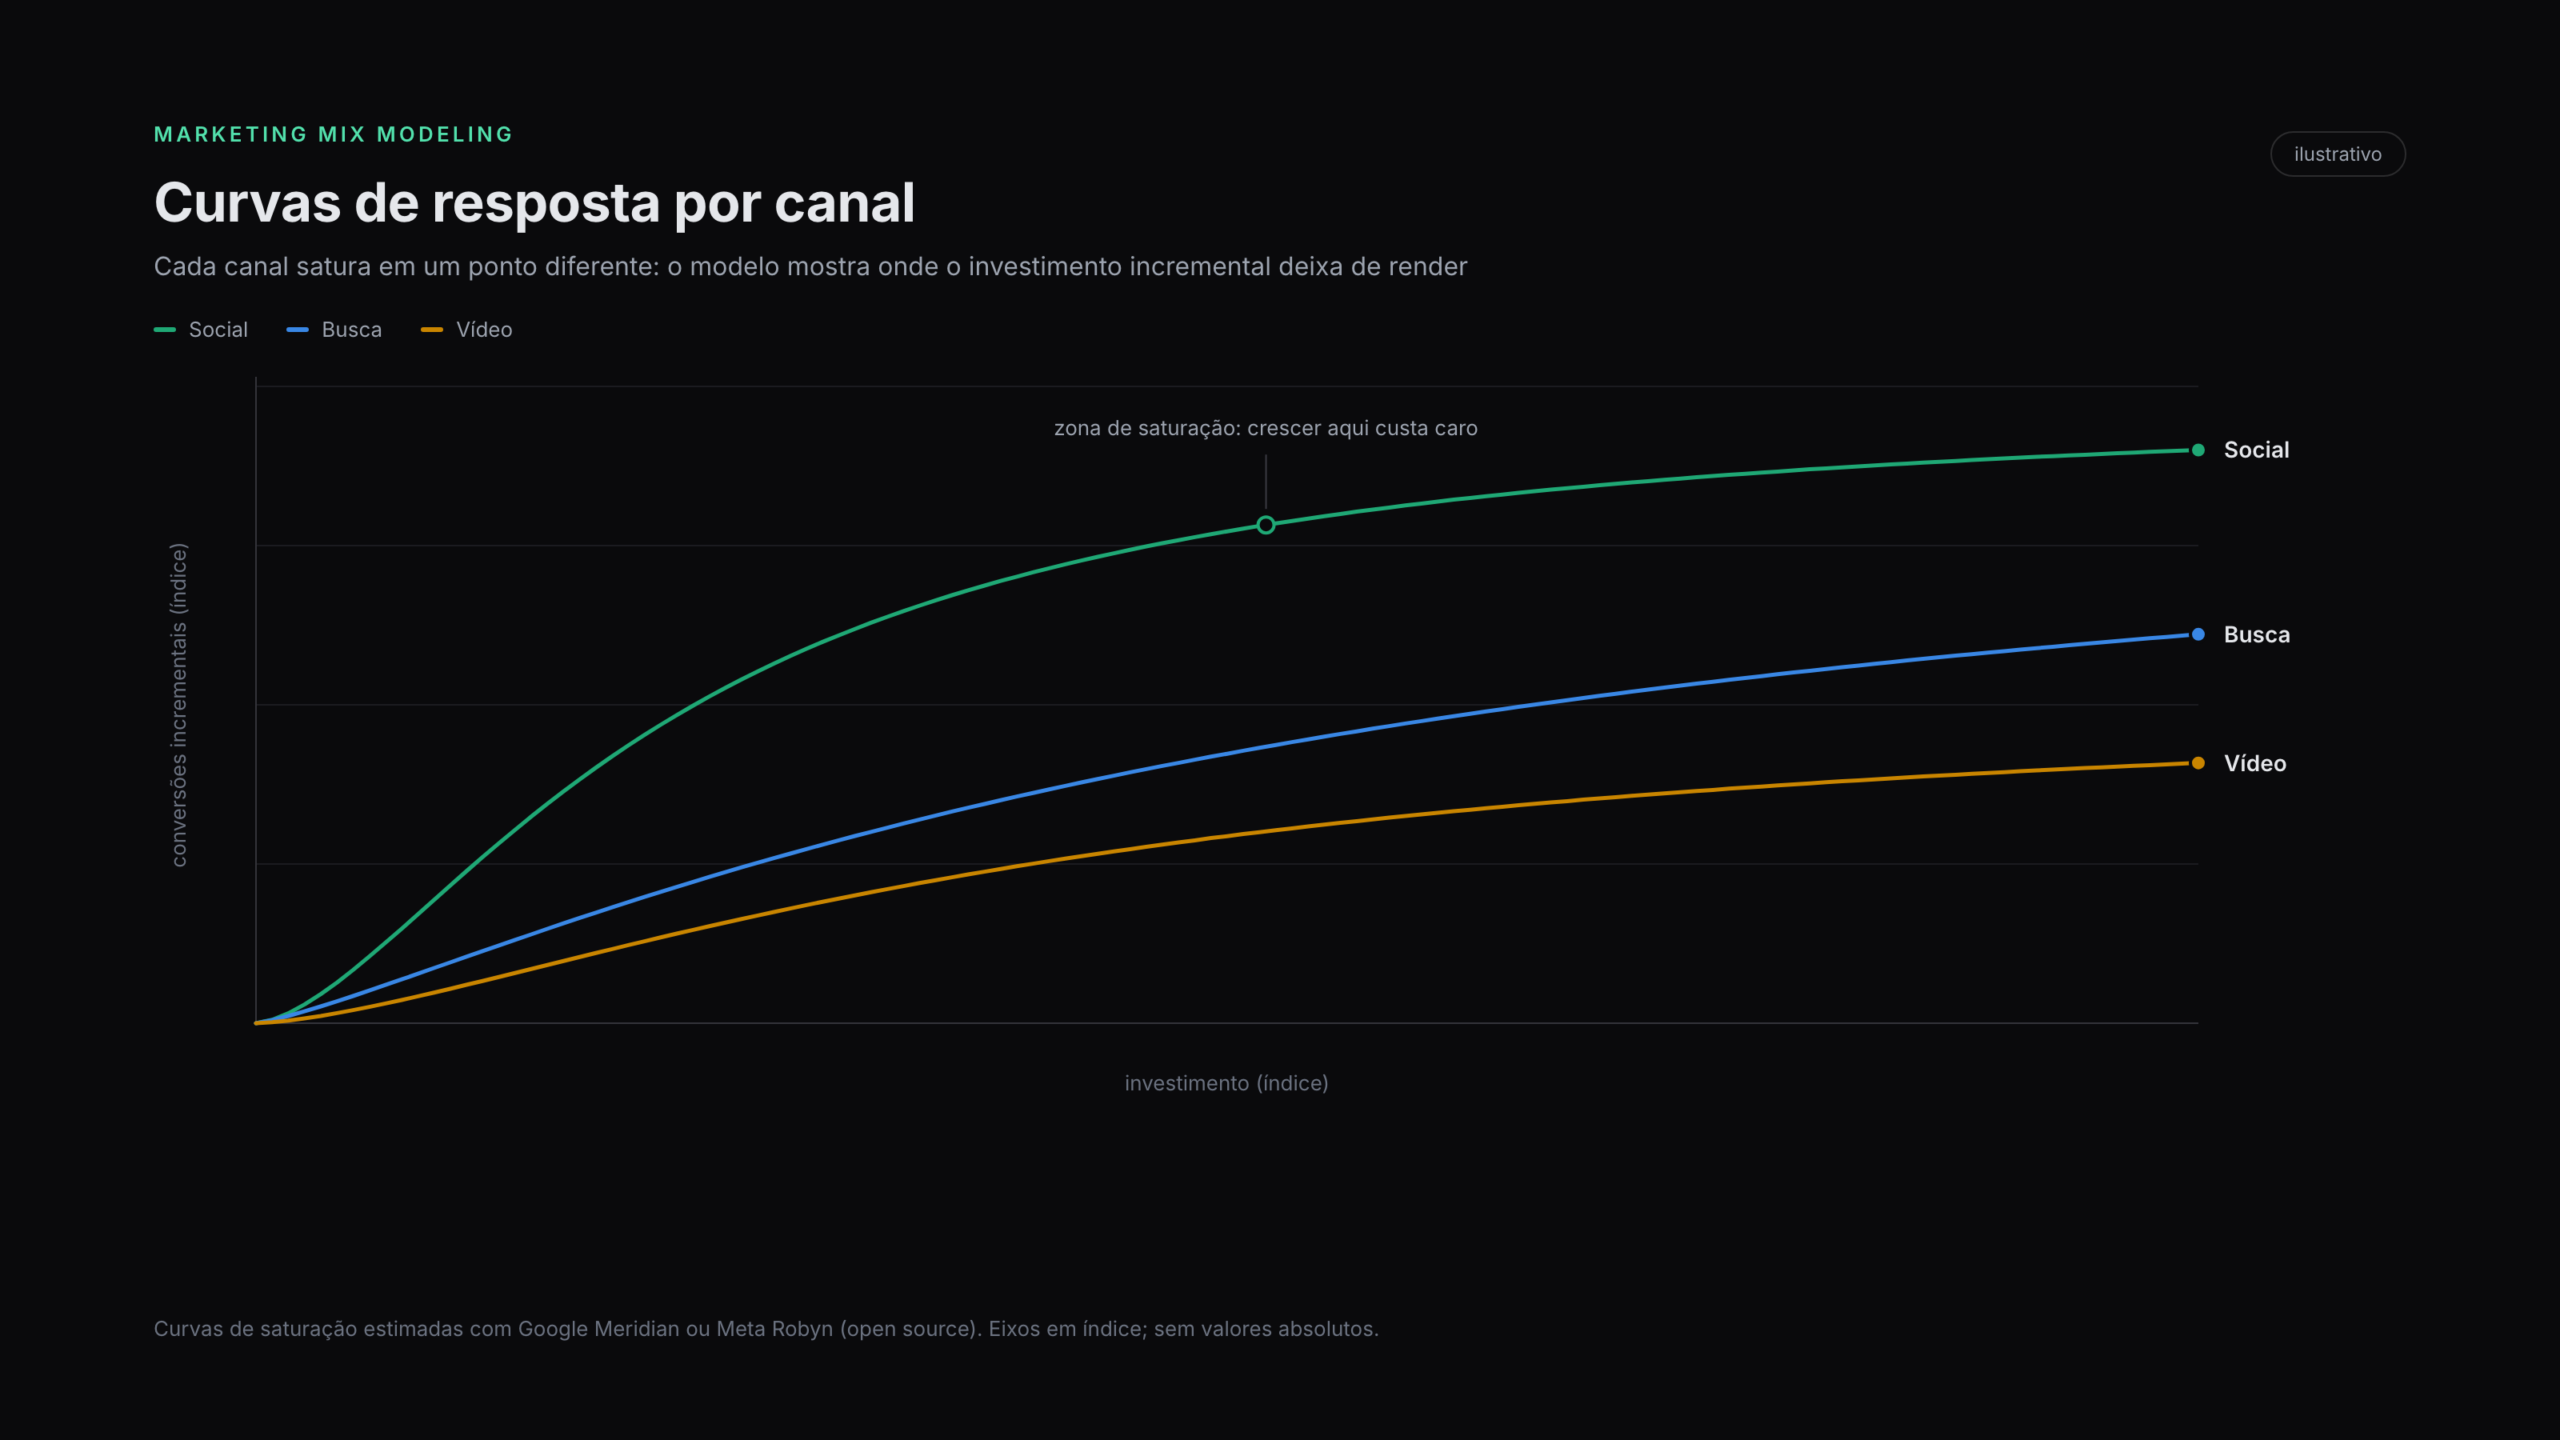
Add up the conversions Meta, Google and TikTok each report and the total is bigger than what your business actually sold. Every channel is claiming credit for the same sale, and last-click rewards whoever showed up last, not whoever did the convincing. Marketing mix modeling settles that argument with statistics: it measures each channel's incremental effect, shows where the curve saturates, and simulates what happens to results when budget moves.
100%
open source: Google Meridian or Meta Robyn, models maintained by the world's two largest ad platforms
4x
per year: quarterly recalibration keeps the model glued to how your operation actually behaves
0
cookies, pixels or user-level data: the model runs on weekly aggregates, immune to privacy changes
Why move beyond last-click
- ●Real incrementality per channel: how many sales would happen anyway, and how much each channel truly drives.
- ●Saturation curves: the exact point where extra budget in a channel stops paying back.
- ●Reallocation scenarios: the projected impact of moving 20% from social to search, before risking the live account.
- ●Long-term effects built in: carryover and adstock capture what last-click never sees, like video and brand.
- ●Zero tracking dependency: aggregate data only, no pixels, no cookies, no iOS drama.
What last-click hides from you
Click-based attribution rewards the bottom of the funnel: retargeting looks like a hero, video and brand look like a cost. Budget drifts to wherever credit shows up, the funnel dries out, and acquisition costs climb while everyone argues about why.
Marketing mix modeling is the technique large advertisers have used for decades to decide cross-channel allocation: a statistical model linking spend, seasonality, pricing and sales, with no individual tracking involved. What changed is that Google open-sourced Meridian and Meta open-sourced Robyn, putting the state of the art within anyone's reach.
What stayed expensive was the data science team to run it. That is where MAX comes in: AI agents, built on Claude, ChatGPT/Codex or Gemini depending on the step, prepare the data, run dozens of model configurations and execute the statistical QA. A senior media strategist validates the model and owns the final read. You pay for a project, not an annual license or a full-time squad.
How the project runs
- 1
Weeks 1 and 2: data
We consolidate media history, sales and external variables such as seasonality, pricing and holidays. The sweet spot is 18 to 24 months of weekly data; we assess what you have before locking scope.
- 2
Weeks 3 and 4: modeling
AI agents run Meridian or Robyn across dozens of configurations, with automated statistical QA on every run. No model reaches the table until a senior strategist has approved it.
- 3
Weeks 5 and 6: readout and scenarios
Response curves, incremental ROI per channel and budget reallocation simulations, presented live and delivered as documentation.
- 4
Every quarter: recalibration
Markets shift and the model keeps up: a fresh run on the latest data, comparing predicted against actuals so you can trust what the curves say.
What you get
- 1
A calibrated model on Google Meridian or Meta Robyn, with code and data in your environment: no license, no tool rental.
- 2
Response and saturation curves per channel, with incremental ROI and carryover (adstock) effects.
- 3
A scenario simulator: reallocate budget across channels and see the projected impact before touching the live account.
- 4
An executive report with a prioritized reallocation plan: what to cut, what to scale, what to test next.
- 5
Optional quarterly recalibration, validating predictions against actuals and adjusting the curves.
Data sources the model consumes





How much history do I need?
Does this replace my attribution?
Who owns the model?
What time zone and language do you work in?
How long until the first readout?
How is it priced?
Stop debating attribution in meetings
Bring your media history and we will tell you, no strings attached, whether an MMM holds up with the data you have today.
Book a scoping call